fnordlicht VU Meter
Last time, I presented some code for visualizing your power consumption using the Fnordlicht modules. Today, we continue the journey in a similar direction: I’ve written a small C program to control the modules according to the current audio volume.
The software monitors the audio signal of my system (Ubuntu 10.10 with Pulseaudio). So you can dance to everything that can play audio 😄…
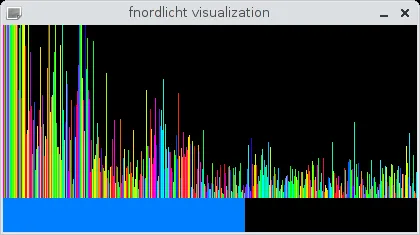
Update: As preparation for an upcoming exam, I added a Discrete Fourier Analysis (DFT). Unfortunately, the serial bus is to slow to visualize the audio spectrogram in real time . The bars are colored with their complex phase->hue (HSV) equivalent.
The software uses libfn a C-library for controlling fnordlichts and is available at Codeberg: /stv0g/libfn/src/fnvum.c .
Some technical details (in German):
Section titled “Some technical details (in German):”Ich benutze PulseAudio um mich in die Soundkarte des Systems einzuklinken. Das Programm tarnt sich als Recording-Tool. Und kann dadurch den kompletten Audio-Output oder nur bestimmte Programme visualisieren. Sogar das Mikrofon kann ich benutzen 😜.
PulseAudio liefert mir einen einfachen PCM Stream (44,1kHz Samplingrate, Mono & 16-Bit signed Integers). Derzeit addiere ich immer nur x Werte dieses Byte Streams und mittele diese Summe dann über einen kurzen Zeitraum.
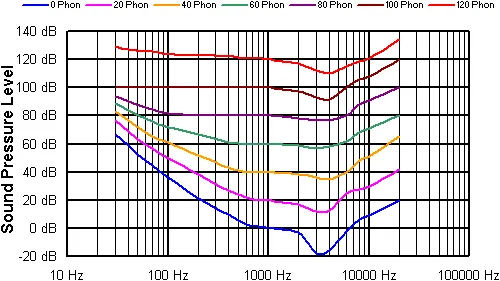
Geplant ist noch eine FFT-Analyse um die Amplituden verschiedener Frequenzen gemäß der “Ohrkurve”, der Empfindlichkeit des menschlichen Gehörs, gewichten zu können. Der Schritt zur Spektral Darstellung (jedes meiner 10 fnordlichter als VU-Meter für ein bestimmtes Frequenzband) ist dann hoffentlich auch nicht mehr so weit.